3 min read
Building a sales forecast: most of the work is not the model
What an end-to-end sales forecast really involves: cleaning, a warehouse, automated loads, evaluated models and dashboards. The model is the smallest part.
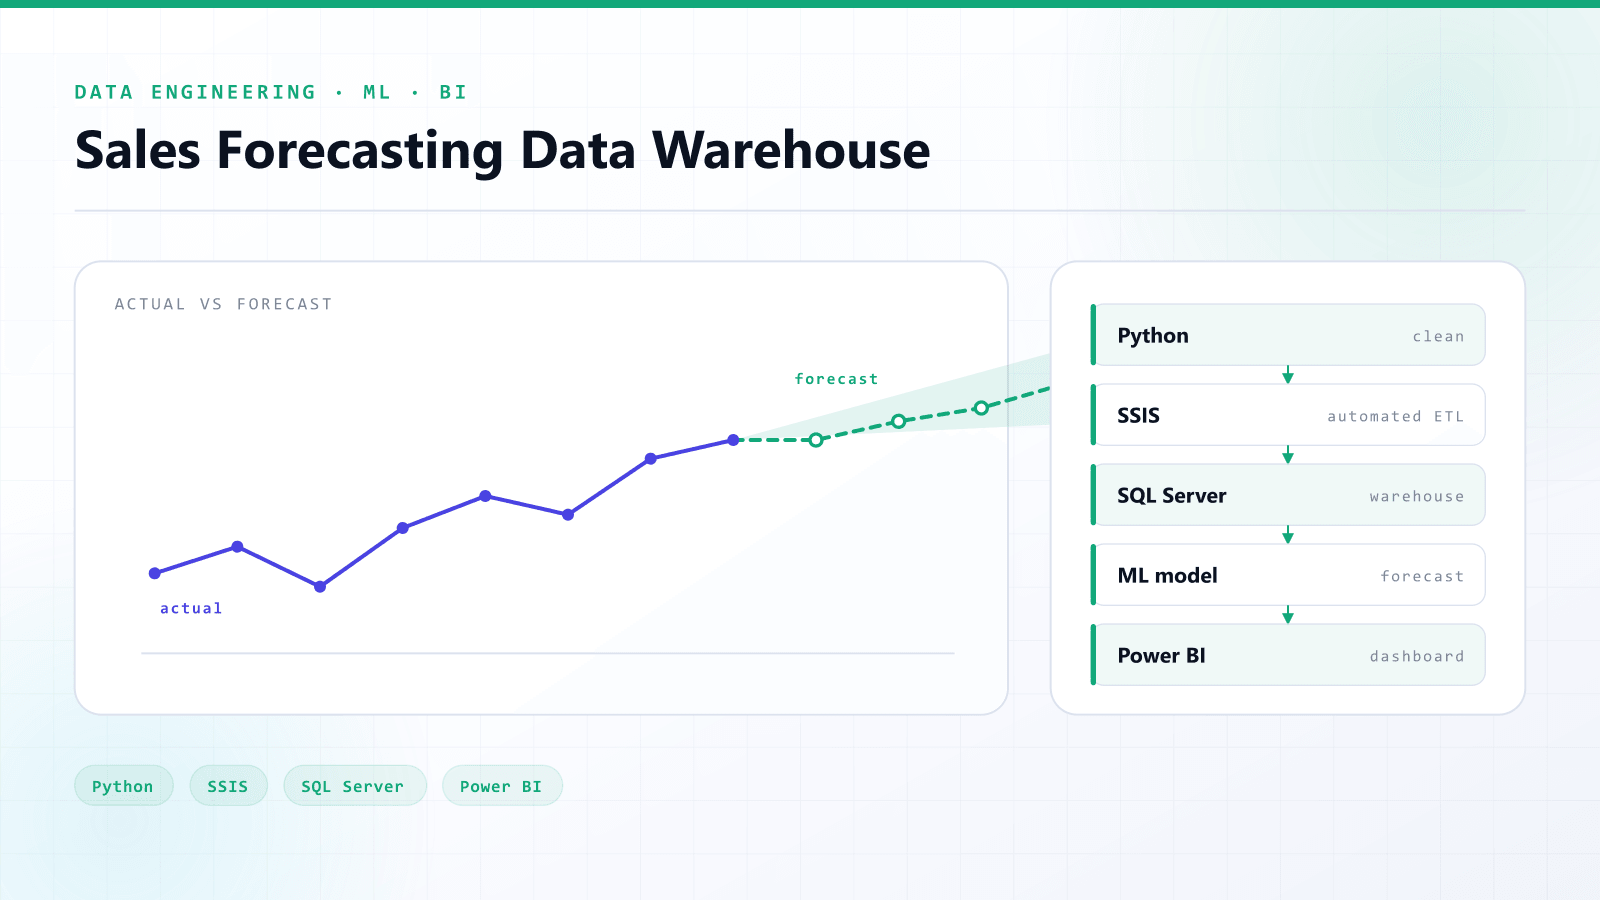
Short answer: a usable sales forecast is a pipeline, not a model. Raw sales data has to be cleaned, stored in a warehouse, refreshed automatically, forecast with an evaluated model, and shown next to actual sales in a dashboard. In my experience cleaning and validation take the most effort, and the model is the smallest part.
Ask most businesses what a sales forecast needs and they will say "a model". In practice the model was the smallest part of the forecasting system I built. Most of the work went into everything around it, which is what makes a forecast something people can actually use to decide what to stock.
This post walks through that system end to end: raw exports in, an actual-vs-forecast dashboard out.
The real question
The question is never "can we predict sales?" It is:
How much will we sell next month, and what should we stock — and can we get that answer again every time new data lands, without redoing it by hand?
That last part is why this cannot be a notebook. A notebook answers the question once. A business needs the answer every week.
The pipeline
Five stages, each with one job:
| Stage | Tool | Job |
|---|---|---|
| Cleaning | Python | Fix types, duplicates and missing values in the raw sales exports |
| Warehouse | SQL Server | Hold clean history in a dimensional model built for analytical queries |
| Loading | SSIS | Run the load on a schedule so a refresh does not depend on a person |
| Forecasting | Machine learning | Predict future sales and score every model with evaluation metrics |
| Reporting | Power BI | Show actual against forecast, alongside stock planning views |
1. Cleaning is where the time goes
Every error upstream flows straight into the forecast. A duplicated order inflates demand. A missing week looks like a sales collapse. Text-typed dates sort in the wrong order.
Most of the effort in this project sat in cleaning and validation, not modelling. That is normal, and a quote that budgets mostly for "the AI part" should make you suspicious.
2. A warehouse, not a folder of CSVs
Clean data goes into a SQL Server warehouse modelled for analytics: facts for sales, dimensions for products, stores and dates. That gives the model and the dashboards one source of truth, and it means a question like "sales by product category by month" is a query, not a spreadsheet exercise.
3. Automate the refresh
SSIS packages schedule the load. It sounds dull, but this is the difference between a forecast that stays current and one that quietly goes stale three weeks after launch because nobody had time to rerun it.
4. Evaluate the model, or do not ship it
Every model is scored with explicit evaluation metrics before its output reaches anyone. An unchecked prediction is a guess with a confident font.
5. Show the forecast next to reality
A predicted number without its error is not ready for a decision. The Power BI dashboards put forecast and actual side by side, so the people planning stock can see how well the model has been tracking. They trust it when it earns trust, and they notice straight away when it drifts.
What to take from this
If you are planning a forecasting project:
- Budget for data quality first. Expect cleaning and validation to be the largest share of the work.
- Ask how it refreshes. If the answer involves a person running a script, it will go stale.
- Ask how it is evaluated. You should see the error, not just the prediction.
- Put the forecast where decisions are made. For most teams that means a dashboard, not a model file.
The full architecture, and the code, are in the case study.
Frequently asked questions
- What do you need to build a sales forecasting system?
- Five parts: a cleaning stage for raw sales data, a data warehouse holding clean history, an automated load so data refreshes on a schedule, a forecasting model scored with evaluation metrics, and a dashboard showing forecast against actual sales.
- What is the hardest part of sales forecasting?
- Data quality. Every upstream error, such as duplicated orders, missing weeks or mistyped dates, flows straight into the forecast. Cleaning and validation typically take more effort than choosing and training the model.
- Can Power BI show a sales forecast?
- Yes. A common setup is to produce the forecast with a machine learning model, store it in the warehouse next to actual sales, and have Power BI show both side by side, so the people planning stock can see how well the model has been tracking.