End-to-End Sales Forecasting Data Warehouse
Data Engineering / Machine Learning / BI
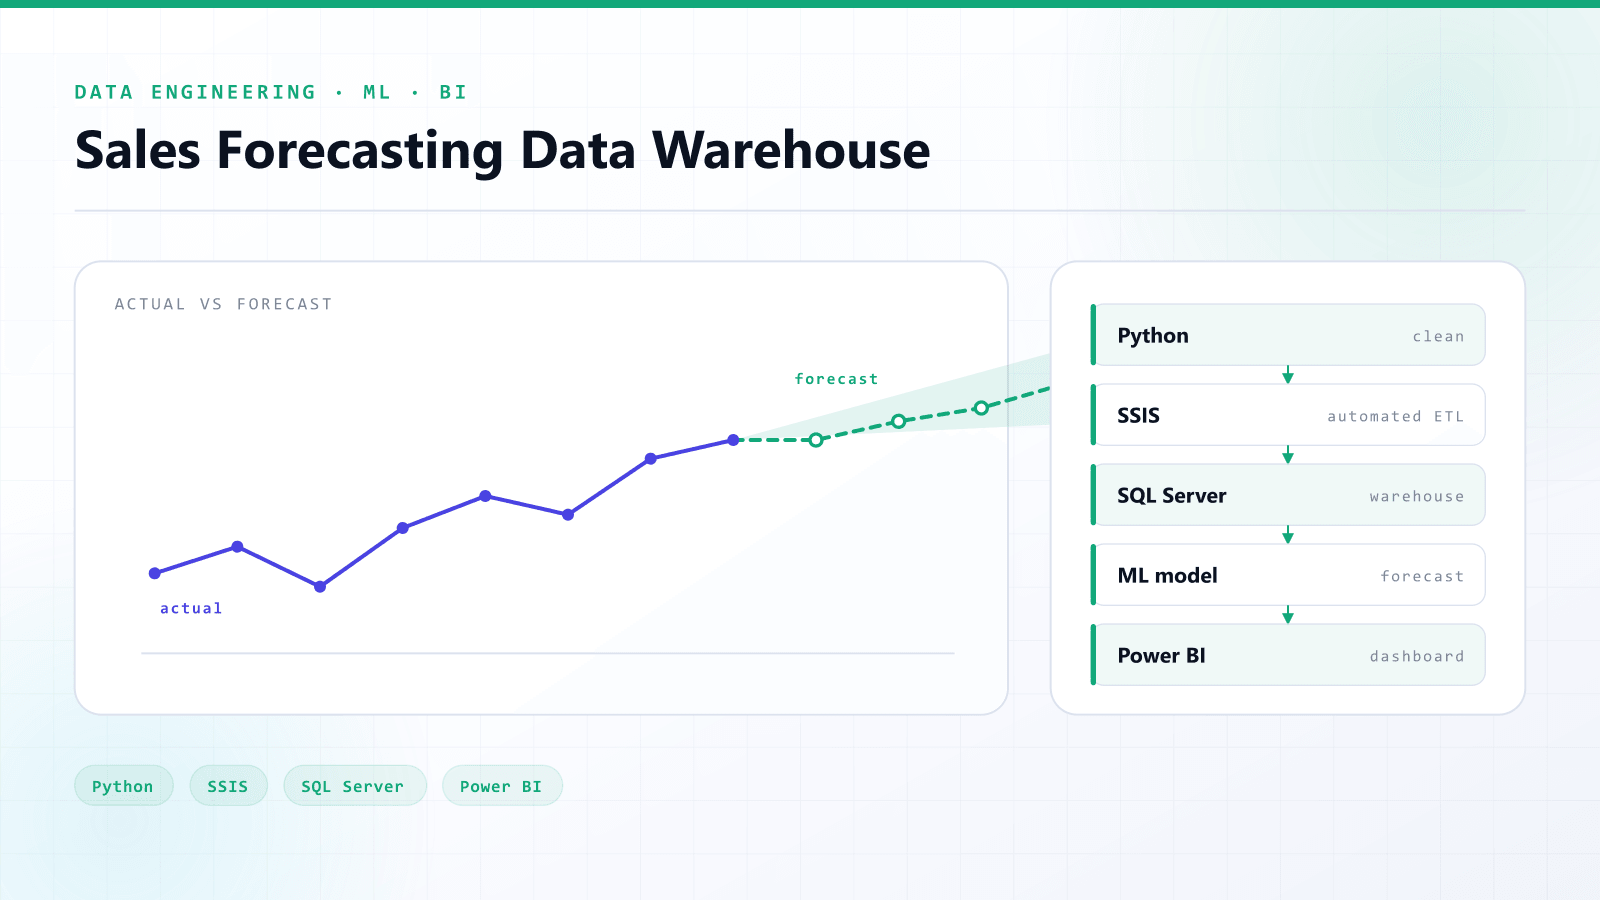
An end-to-end analytics solution that cleans raw sales data with Python, stores it in a SQL Server data warehouse, and forecasts future sales with machine learning. It includes automated ETL with SSIS, predictive modelling with evaluation metrics, and interactive Power BI dashboards for actual vs forecasted sales and stock planning.
- Year
- 2024
- Role
- Data engineer & analyst
- Source
- Public repository
Technologies
- Python
- SQL Server
- SSIS
- Machine Learning
- Power BI
- Data Warehouse
- ETL
The problem
Sales history sits in messy operational exports. Answering "how much will we sell next month, and what should we stock" means cleaning, modelling and forecasting — and repeating all three every time new data lands.
The solution
A full analytics stack rather than a notebook. Python handles cleaning, a dimensional SQL Server warehouse holds the clean history, SSIS automates the load, machine learning produces the forecast, and Power BI puts actual against forecast for the people who make the stocking decisions.
Architecture
How it is put together.
Cleaning
Python normalises raw sales exports, resolving types, duplicates and missing values.
Warehouse
Clean data lands in a SQL Server data warehouse modelled for analytical querying.
Automated ETL
SSIS packages schedule and automate the load so refreshes are not manual.
Forecasting
Machine learning models predict future sales and are scored with evaluation metrics.
Dashboards
Power BI presents actual vs forecast alongside stock planning views.
Key features
What it actually does.
- Reproducible Python cleaning stage
- Dimensional SQL Server warehouse
- Scheduled SSIS ETL automation
- Evaluated predictive models rather than unchecked outputs
- Interactive actual-vs-forecast and stock planning dashboards
Engineering challenges
The parts that were hard.
Data quality upstream
Forecasts inherit every upstream error. Most of the effort sat in cleaning and validation rather than modelling.
Forecasts need context
A predicted number without its error is not decision-ready. Dashboards present forecast against actual so the model stays continuously visible.
Outcomes
What came out of it.
Qualitative outcomes only — no invented benchmarks or metrics.
One automated path from raw export to executive dashboard
Forecasts evaluated with explicit metrics
Stock planning driven by the same pipeline that reports history
Next project
AI Record Manager & Vector Database Sync
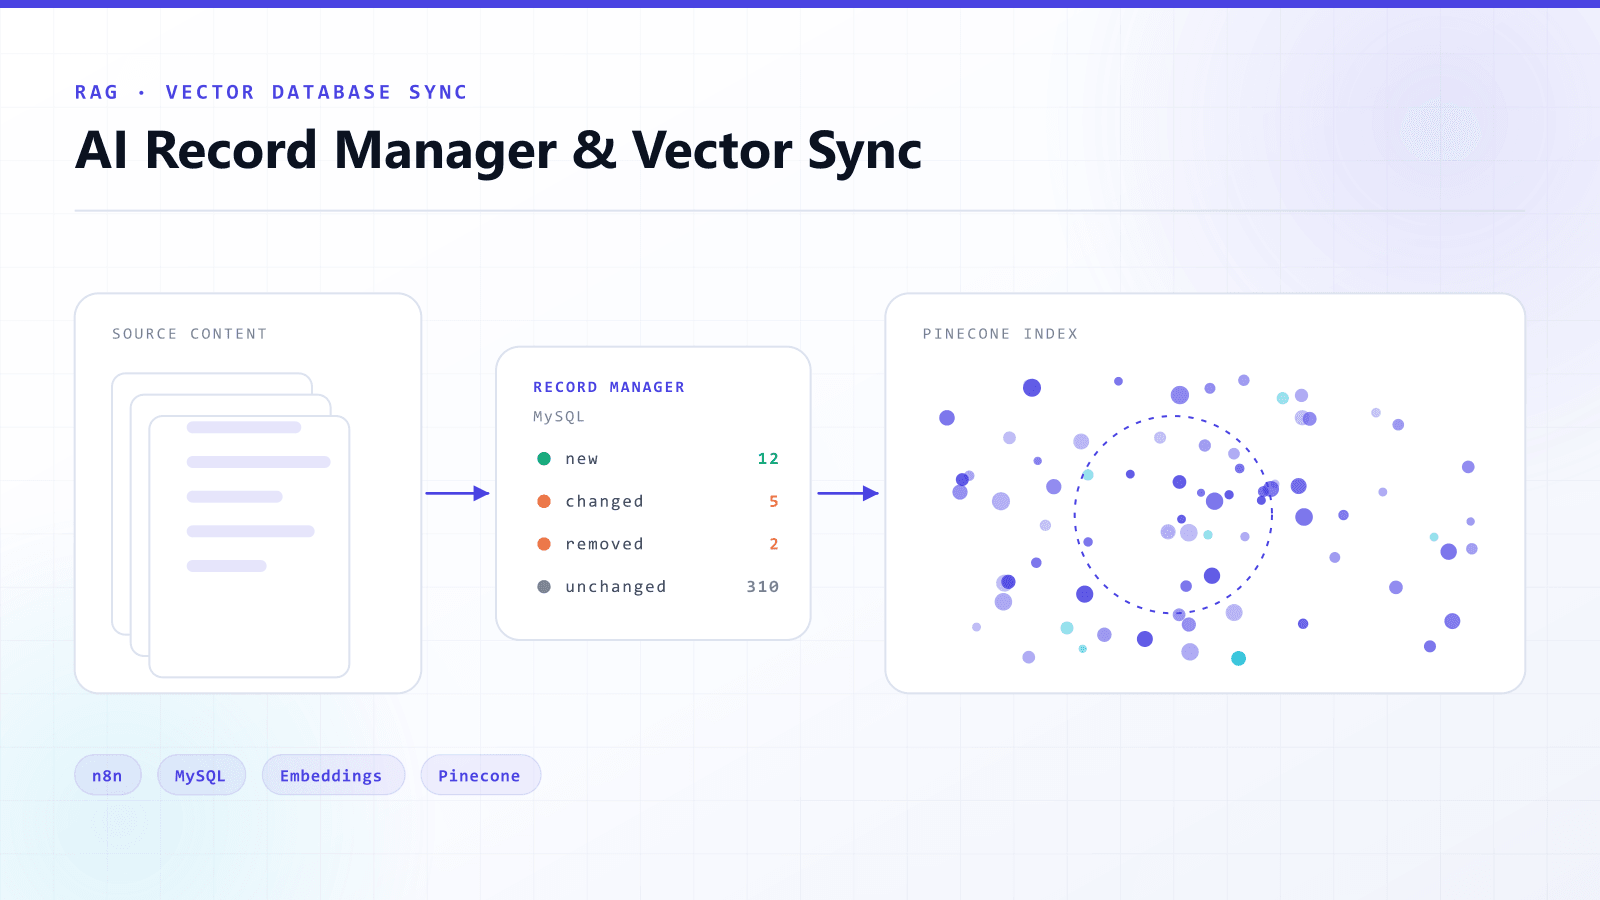
Keeps a Pinecone index and a MySQL record manager in sync with changing source content.
Let’s build
Want something like this for your business?
Tell me the problem and I will come back with an architecture, a scope and a timeline.