Call Processing Pipeline with Neo4j Graph AI
AI / Graph Databases / Data Engineering
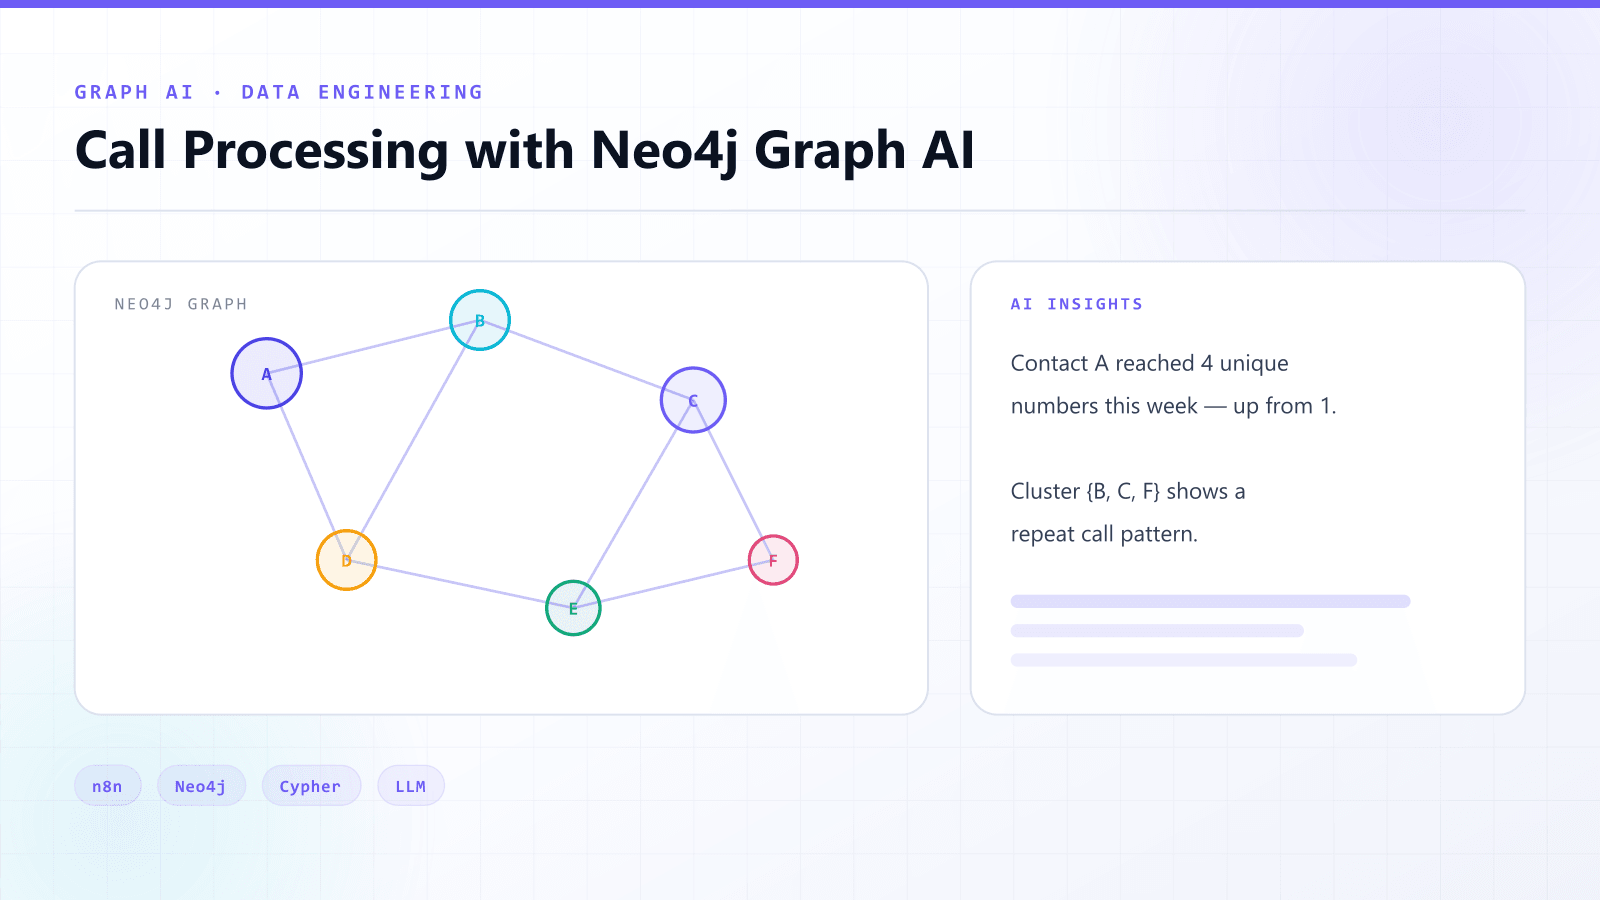
An end-to-end AI-powered call intelligence system built in n8n that turns raw call webhook data into structured, actionable insight. It receives call events, extracts caller, callee, duration and recording metadata, and stores them in a Neo4j graph database.
- Year
- 2025
- Role
- Automation & data engineer
- Source
- Public repository
Technologies
- n8n
- Neo4j
- Cypher
- LLMs
- Webhooks
- Data Pipelines
The problem
Call platforms emit events, not understanding. Who spoke to whom, how often, and what patterns exist across a whole account are relationship questions — and relationship questions are exactly what a row-per-call table answers badly.
The solution
Model calls as a graph. People, numbers and calls become nodes and edges in Neo4j, so "everyone this contact reached last month" is a traversal rather than a chain of joins. AI then reads the structured result and writes the insight layer on top.
Architecture
How it is put together.
Webhook ingest
Call events arrive at an n8n webhook as they happen.
Metadata extraction
Caller, callee, duration and recording metadata are pulled out and normalised.
Graph modelling
Entities and their relationships are written into Neo4j as nodes and edges.
Graph queries
Cypher queries surface connection patterns, frequency and reach across the graph.
AI insight generation
An LLM reads the structured query results and produces readable, actionable insights.
Key features
What it actually does.
- Real-time webhook ingestion of call events
- Normalised metadata extraction
- Neo4j graph model of people, numbers and calls
- Cypher-based relationship analysis
- AI insight layer grounded in structured results
Engineering challenges
The parts that were hard.
Identity resolution
The same person appears as several numbers and formats. Normalising before writing to the graph prevents one contact from becoming five nodes.
Grounding the AI layer
Insights are generated from query results rather than raw events, so the model summarises facts the graph has already established.
Outcomes
What came out of it.
Qualitative outcomes only — no invented benchmarks or metrics.
Call history queryable as relationships instead of flat rows
Insight generation grounded in structured graph output
A pipeline that runs continuously from webhook to insight
Next project
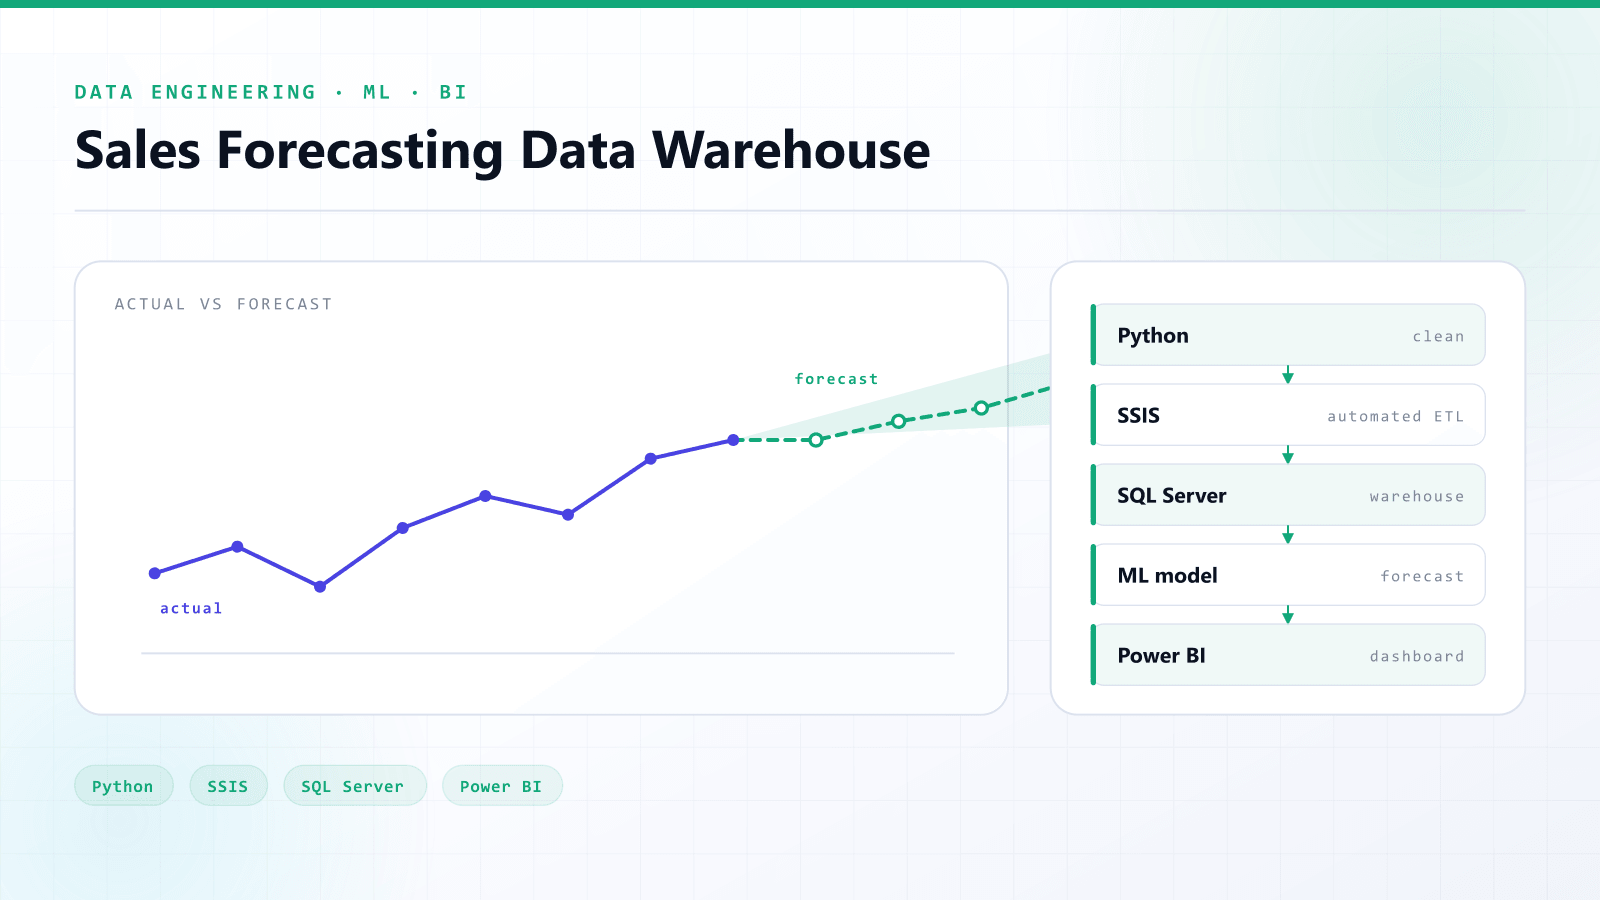
End-to-End Sales Forecasting Data Warehouse
Python cleaning, a SQL Server warehouse, SSIS ETL, ML forecasts and Power BI dashboards.
Let’s build
Want something like this for your business?
Tell me the problem and I will come back with an architecture, a scope and a timeline.