3D Point Cloud Study in Python
3D Data / Visualisation / Client Work
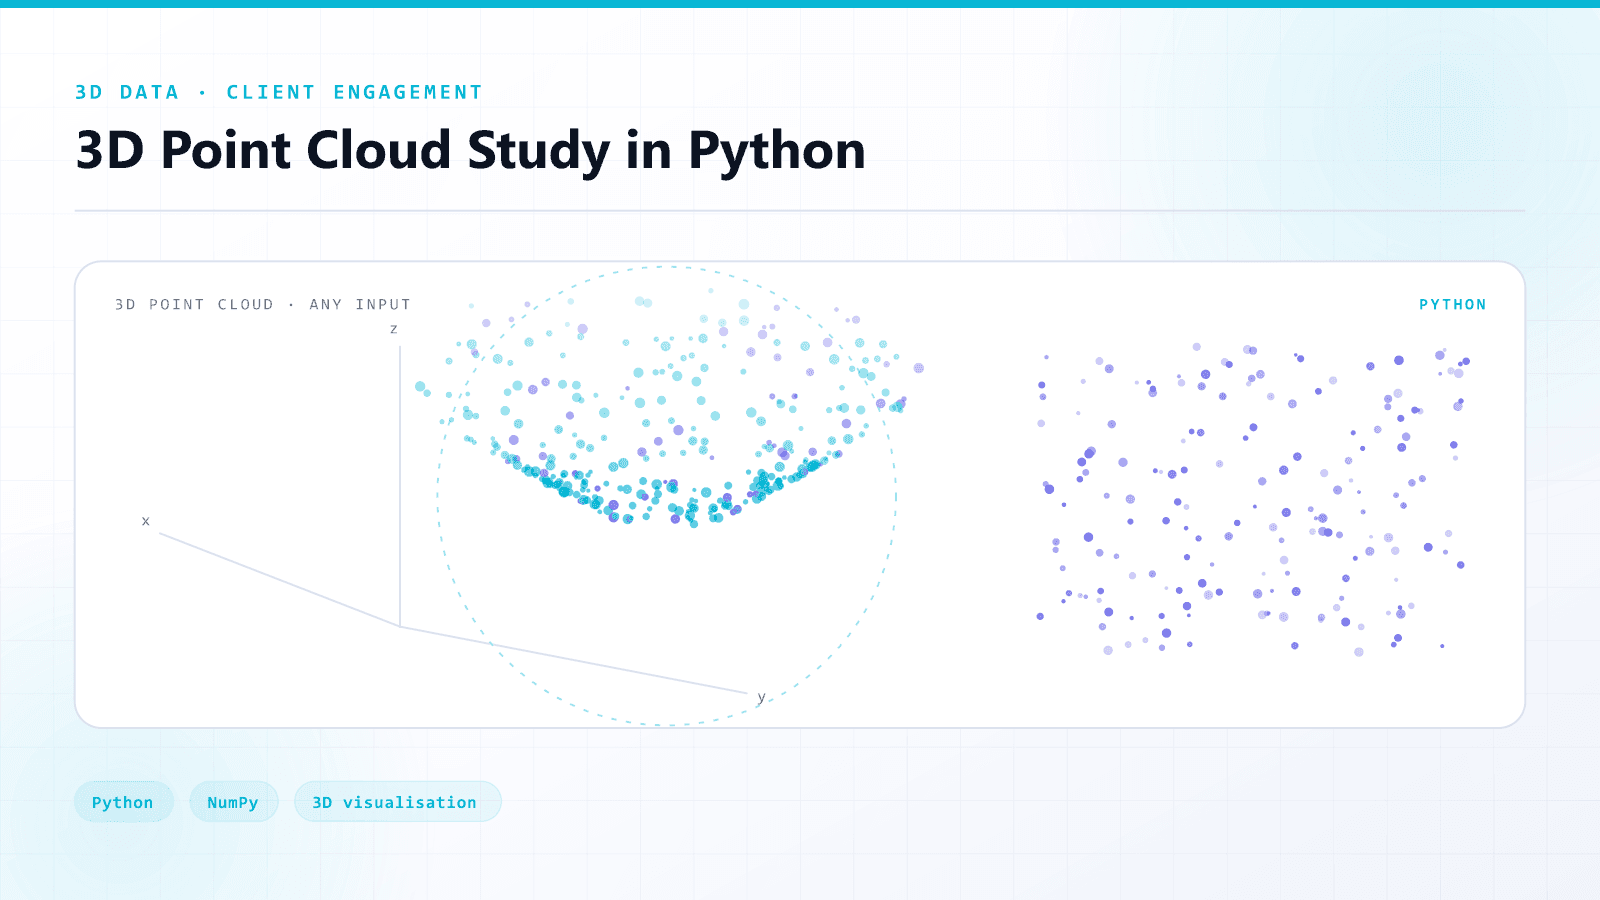
A client engagement reproducing a point cloud study in Python with 3D display, documented step by step and generalised so the code runs on arbitrary point clouds rather than one fixed dataset.
- Year
- 2024
- Role
- Freelance engagement via Upwork
- Source
- Public repository
Technologies
- Python
- Point Clouds
- 3D Visualisation
- NumPy
- Jupyter
The problem
An existing point cloud study needed to be reproduced in Python and, more importantly, made to work on point clouds other than the one it was written for.
The solution
Rebuild the study as documented, generalised Python: 3D display working end to end, with the basic steps written down so the process can be repeated on new data.
Architecture
How it is put together.
Load
Point cloud data is read into a working representation.
Process
The study's processing steps are reimplemented in Python.
Display
Results are rendered as 3D visualisation.
Generalise
Hardcoded assumptions are removed so the code accepts any point cloud.
Key features
What it actually does.
- Python reimplementation of the original study
- 3D visualisation of results
- Documented step-by-step instructions
- Generalised to arbitrary point cloud inputs
Engineering challenges
The parts that were hard.
Generalisation over reproduction
Matching one dataset is straightforward; working on any input means finding and removing every implicit assumption.
Outcomes
What came out of it.
Qualitative outcomes only — no invented benchmarks or metrics.
Delivered and rated 5.0 by the client on Upwork
Reusable code that runs beyond the original dataset
Next project
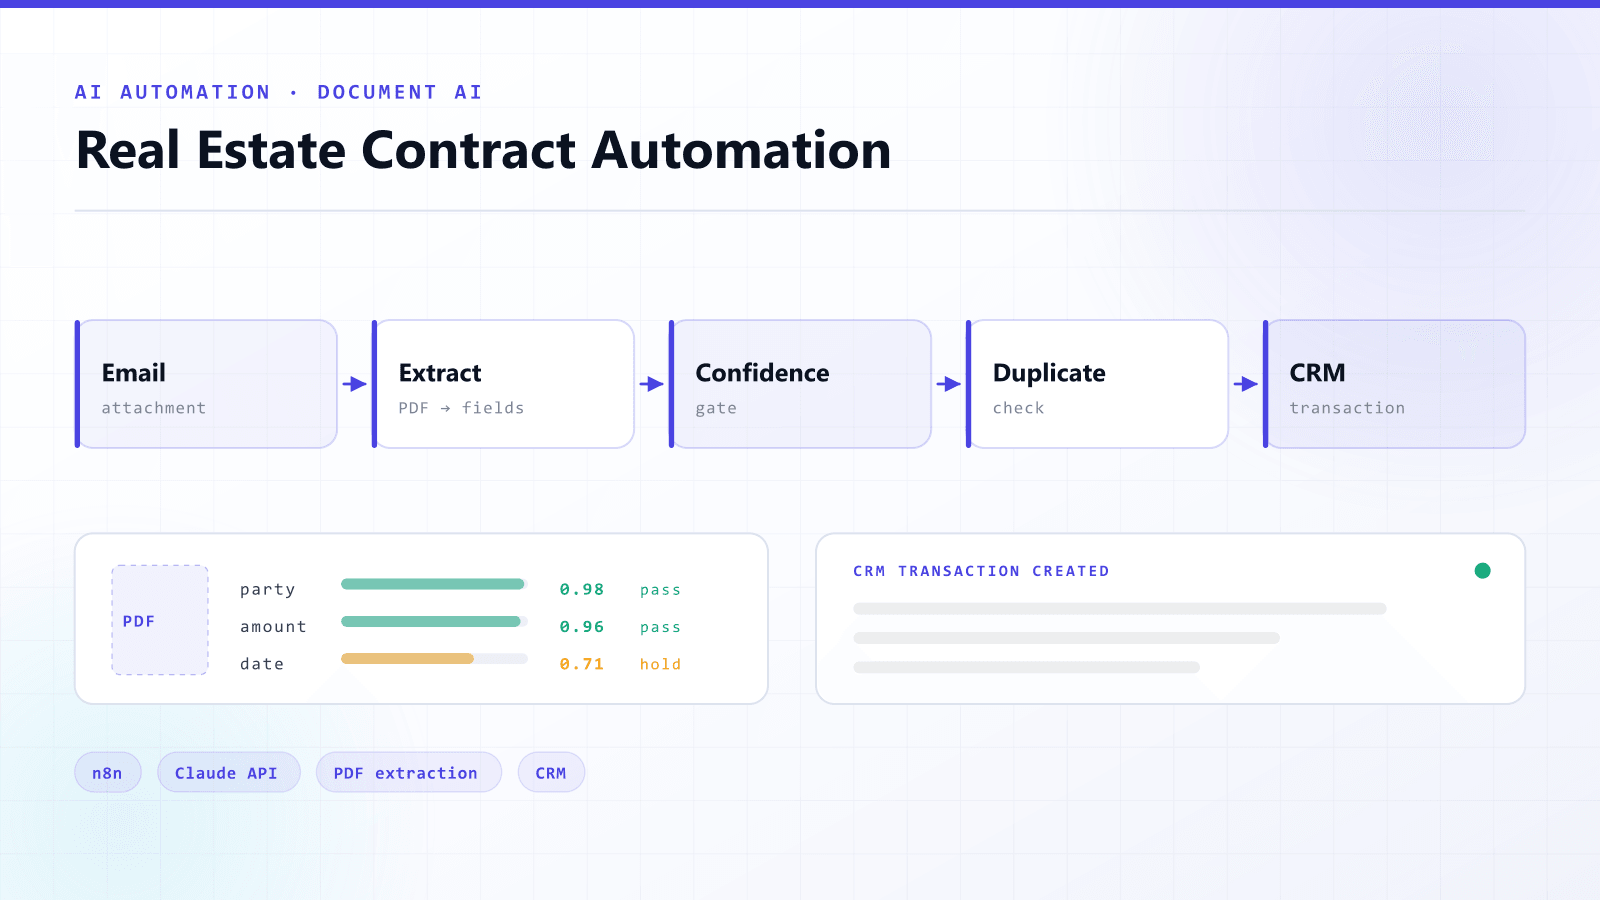
Real Estate Contract Automation
Email-triggered pipeline that reads PDF contracts and creates CRM transactions.
Let’s build
Want something like this for your business?
Tell me the problem and I will come back with an architecture, a scope and a timeline.